

Incrementality testing is a controlled experiment that isolates the true causal impact of a marketing campaign by comparing a treatment group exposed to your ads against a control group that is not. The difference in outcomes between those two groups is your incremental lift: the conversions, revenue, or sign-ups your campaign genuinely caused, rather than simply coincided with. Attribution models assign credit across touchpoints but cannot prove causation. Incrementality testing can. That distinction drives every budget decision worth making.
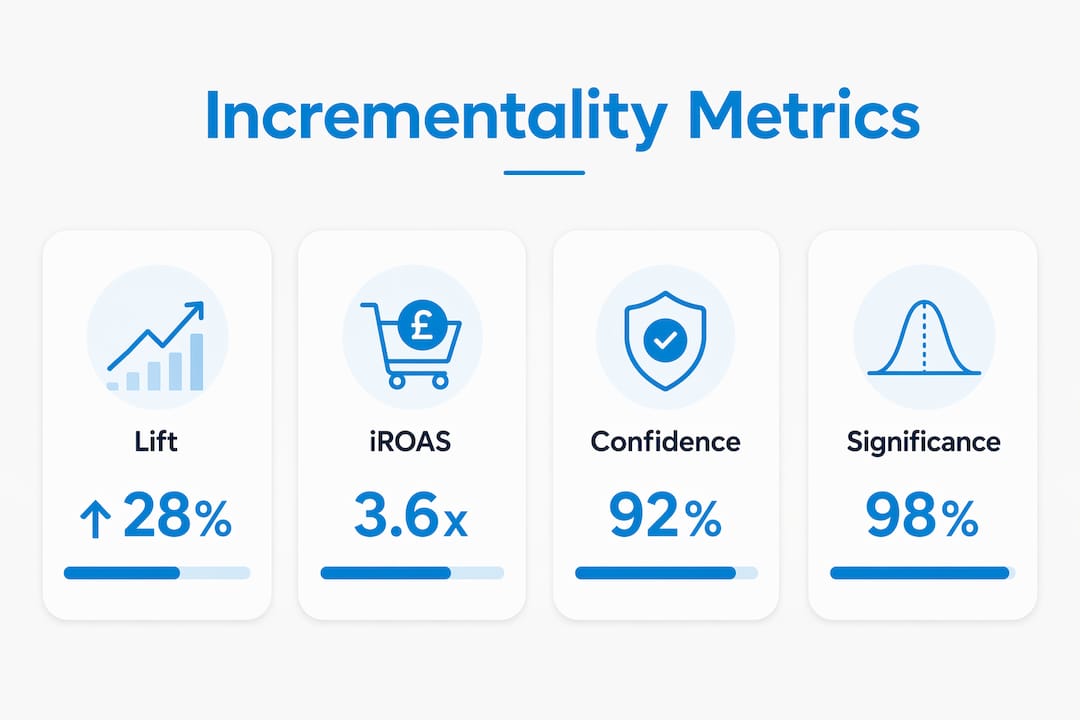
The metric that matters most is incremental ROAS (iROAS), calculated by dividing incremental revenue by campaign spend. Platform-reported ROAS inflates efficiency because it counts conversions that would have happened organically. iROAS strips those out. The industry standard for declaring a result trustworthy is a 95% confidence interval, meaning there is only a 5% probability the measured lift occurred by chance.
Flow20, a London-based digital marketing agency, applies these methods across paid media, SEO, and conversion rate optimisation for UK small and mid-sized businesses, using AI-led research and testing to translate lift data into concrete budget decisions.
Key reasons UK marketing teams are prioritising this approach:
- Privacy restrictions have made user-level attribution less reliable, pushing teams toward experiment-based measurement
- Platform-reported conversions routinely overstate true impact, as a retailer running branded search ads may find that most of those conversions would have arrived via organic search anyway
- iROAS gives finance teams a figure they can act on, not a platform metric padded with organic demand
How to run incrementality tests that produce reliable results
Three methodologies dominate, each suited to different campaign types and data environments.

Randomised holdout tests are the industry gold standard. You randomly withhold ads from a subset of your audience and compare conversion rates between the two groups. This works well for digital campaigns where you control audience targeting at the user level.
Geo-based experiments designate geographic regions as test and control markets. They suit TV, out-of-home, and retail media where user-level holdouts are impractical. Haus used this approach for TikTok campaigns, running experiments over a multi-week period to detect lift.
Synthetic control and Bayesian time-series modelling apply when randomisation is not possible. The CausalImpact method, developed by Google researchers, constructs a counterfactual time series from control markets to estimate what would have happened without the intervention.
Best practices for execution:
- Run tests on your largest budget channels first, where proving lift has the greatest financial consequence
- Use multi-week durations to accumulate sufficient conversions and capture the full purchase cycle
- Isolate one variable per test: changing creative and budget simultaneously makes it impossible to attribute any observed difference
- Control for seasonality by running both groups through the same external conditions
- Integrate first-party data sources to reduce measurement noise
Pro Tip: Before launching any test, audit your data infrastructure. Clean, unified, first-party datasets are a prerequisite for valid causal inference. Noisy or incomplete data does not just reduce precision; it can produce conclusions that point in the wrong direction entirely.
Key metrics: lift, iROAS, and how to interpret them
Absolute and percentage lift
Absolute lift is the raw difference in outcomes between your treatment and control groups. Percentage lift normalises that by the control group baseline: ((Treatment conversions − Control conversions) ÷ Control conversions) × 100. Percentage lift communicates well to stakeholders; absolute lift is more useful when calculating incremental revenue value.
| Metric | Formula | Example |
|---|---|---|
| Absolute lift | Treatment mean − Control mean | — |
| Percentage lift | (Absolute lift ÷ Control mean) × 100 | — |
| iROAS | Incremental revenue ÷ Campaign spend | — |
Incremental ROAS
iROAS is the metric that separates genuine campaign efficiency from platform flattery. A channel can show a 6x platform ROAS while being nearly non-incremental, capturing credit for purchases that were already going to happen. iROAS divides only the incremental revenue by ad spend, giving you the return your campaign actually created. Google’s own scenario examples illustrate this clearly: a beauty brand discovering an iROAS of £6 on Performance Max has real evidence to scale; a financial institution finding £1.10 iROAS on YouTube has a clear signal to reconsider creative or targeting before increasing spend.
Confidence intervals and statistical significance
A point estimate without a confidence interval is incomplete. The 95% confidence interval tells you the range within which the true lift falls with 95% certainty. If that interval excludes zero, your result is statistically significant. A wide interval spanning zero means the test was underpowered, not necessarily that the channel is non-incremental.
Supporting metrics worth tracking alongside lift and iROAS:
- Net incremental revenue (absolute financial impact of the campaign)
- Conversion lift by audience segment (reveals which cohorts respond most)
- Longer-term behavioural indicators such as repeat purchase rates and customer lifetime value
How Flow20 applies incrementality testing for UK clients
Flow20 operates from London and specialises in AI-led campaign measurement integrated with paid media and conversion rate optimisation. For UK businesses running PPC and paid social campaigns, the agency uses holdout-based lift analysis to move budget decisions away from platform-reported figures and toward causal evidence.
A typical Flow20 engagement works as follows. A client running Google Ads and paid social simultaneously cannot tell from attribution data which channel is driving genuine new demand. Flow20 designs a geo-based holdout test, withholds spend in matched control markets, and measures iROAS across both channels after a multi-week window. The results routinely reveal that one channel is capturing organic demand rather than creating it, freeing budget to scale the genuinely incremental activity.
Practical takeaways for UK marketing teams:
- Start with your highest-spend channel, where the financial stakes of misattribution are greatest
- Use remarketing campaign data alongside holdout results to distinguish retargeting efficiency from true new-customer acquisition
- Combine lift findings with conversion rate optimisation to act on what the data reveals, not just measure it
- Frame holdout costs to stakeholders as an investment in long-term efficiency, not a short-term revenue sacrifice
Brands like Mondelēz have demonstrated what this looks like at scale: a matched-market test delivered a £2.41 incremental ROAS and 14% lift in in-store sales across 116 locations, isolating causal lift by comparing matched markets. UK teams can apply the same logic at smaller budgets.
Pro Tip: AI tools are accelerating this process. Combining incrementality test results with predictive optimisation platforms allows continuous campaign refinement rather than periodic manual reviews, compressing the time between insight and action.
Challenges, limitations, and alternative approaches
Incrementality testing is not without friction. Randomised experiments require withholding ads from a control group, creating a direct short-term revenue cost. That trade-off needs internal justification before the test begins, not after results come in.
Common barriers and pitfalls:
- Insufficient sample size: Tests under 1,000 per group may miss small but meaningful lifts. Power calculations before launch are non-negotiable.
- Accuracy concerns: Adoption of incrementality testing outpaces maturity. Many teams test at only a basic level, which limits confidence in results.
- Multi-channel complexity: Applying holdout logic across paid search, social, and display simultaneously requires careful design to avoid contamination between test arms.
- Data quality: Noisy or fragmented data undermines causal inference regardless of how well the experiment is designed.
- Ignoring confidence intervals: A non-significant result does not mean a channel is non-incremental. A wide interval centred near zero signals an underpowered test; a narrow interval near zero suggests genuine non-incrementality. These require different responses.
When randomisation is not feasible, Bayesian structural time-series modelling via CausalImpact offers a rigorous alternative. It constructs a synthetic counterfactual from control time series, estimating what would have happened without the intervention. The method assumes the control series were not themselves affected by the campaign, so validating that assumption is critical before acting on results.
Incrementality testing complements attribution and marketing mix modelling rather than replacing either. Attribution guides daily creative and audience optimisation; marketing mix modelling provides the cross-channel strategic view; incrementality validates whether campaigns drive genuine lift. The strongest measurement programmes use all three.
Budget and timeline best practices for incrementality tests
Budget planning for incrementality testing centres on two costs: media spend during the test period and the revenue foregone by the holdout group. Holdout groups are typically kept at 5–10% of the target audience to limit that cost while maintaining enough volume for statistical power.
Timeline guidance:
- User-level randomised tests on platforms such as Meta typically require 1–4 weeks, depending on conversion volume
- Geo-holdout tests need at least 4–6 weeks to smooth out local market noise and seasonal fluctuations
- The measurement window must account for conversion latency: if a meaningful share of your conversions occur 14 or more days after ad exposure, a 7-day test will systematically undercount lift
Start with the channel where the largest budget is at stake. Proving or disproving incrementality there has the greatest financial consequence and builds the internal case for expanding the programme.
Design considerations for paid search and social media tests
Paid search and paid social present distinct design challenges. Search campaigns capture demand that may already exist organically, making it especially important to test whether ads are creating new intent or simply intercepting it.
For paid search, geo-based holdouts work well: pause ads in matched control regions and compare traffic and revenue outcomes. Testing different keyword match types or bid levels within the same framework reveals where incremental gains actually sit.
For social media, user-level holdouts are more practical. Platforms including Meta offer built-in conversion lift tools that randomly exclude a percentage of your audience from seeing ads. The key design rule is to isolate one variable per test. Launching new creative and increasing budgets simultaneously produces results you cannot interpret cleanly.
Across both channels, server-side tracking reduces measurement error caused by cookie blocking and cross-device behaviour, giving you a more complete picture of true incremental conversions.
Statistical significance and power analysis
Statistical power is the probability your test detects a true lift if one exists. Running an underpowered test and finding a non-significant result tells you almost nothing useful. The standard approach sets power at 80% and significance at 95% (p < 0.05).
Tests under 1,000 per group risk missing small but commercially meaningful lifts. For geo experiments targeting a 10% lift detection with 80% power, aim for 10–20 markets per group, selected based on consistent baseline behaviour and historical correlation.
Before launching, calculate your minimum detectable effect: the smallest lift that would actually change a budget decision. If a 5% improvement would not move spend, do not design a test to detect 5% changes. Align the effect size threshold with your real decision criteria, then work backwards to the required sample size and test duration.
Key takeaways
Incrementality testing produces reliable causal evidence only when tests are properly powered, holdout groups are cleanly isolated, and results are interpreted with confidence intervals rather than point estimates alone.
| Point | Details |
|---|---|
| iROAS over platform ROAS | Divide incremental revenue by spend to measure true campaign efficiency, not attributed totals. |
| 95% confidence interval standard | Declare a result trustworthy only when the confidence interval excludes zero at the 95% level. |
| Power before you launch | Groups under 1,000 risk missing meaningful lifts; calculate minimum detectable effect first. |
| Holdout costs are an investment | Short-term revenue sacrifice from control groups is justified by long-term budget efficiency gains. |
| Complement, not replace | Use incrementality alongside attribution and marketing mix modelling for a complete measurement picture. |
Flow20’s PPC management services integrate incrementality testing directly into campaign planning, so UK businesses can allocate paid media budgets based on causal evidence rather than platform-reported figures. If you want to know which campaigns are genuinely driving growth, speak to Flow20 about building a measurement programme that answers that question with confidence.
Recommended
- How to Tweak Your Remarketing Campaign to Increase ROI Effectively – Online Marketing Blog | Flow20
- Converting Website Visitors into Diners via Incentives: Effective Strategies for Boosting Restaurant Engagement – Online Marketing Blog | Flow20
- 3 Tested Ways To Improve Your Google Ads Quality Score
- How to Tweak Your Remarketing Campaign to Increase ROI – Part 2 – Online Marketing Blog | Flow20


